HV Explorer
The HV Explorer is a powerful, Python-based GUI developed by qtec for the visualization, manipulation, and analysis of Hyperspectral Imaging (HSI) datacubes. Designed primarily for the "Proof of Concept" and exploratory phases of a project, it allows researchers and engineers to validate HSI workflows without writing a single line of code.
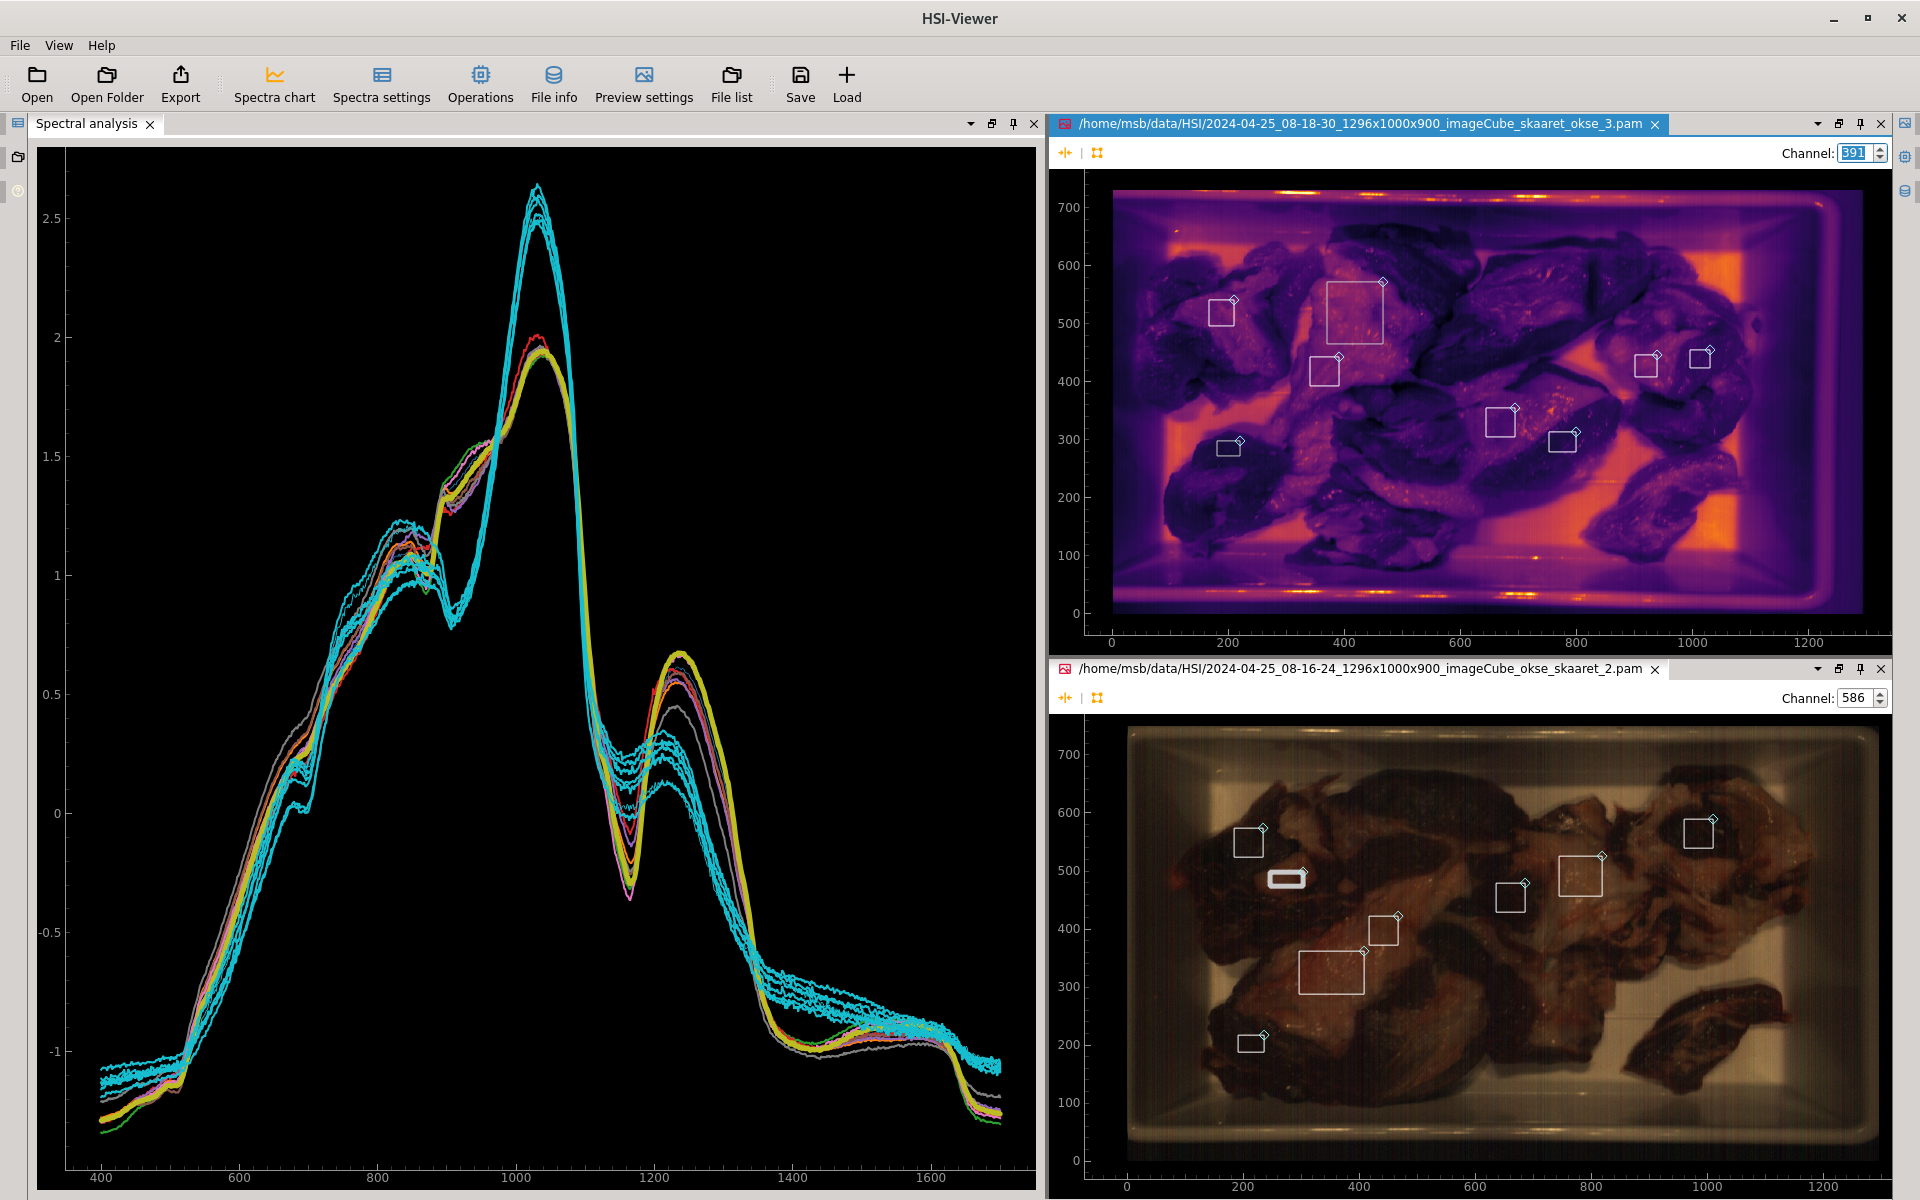
Visualization of the spectral curves of meat and fat regions in HV Explorer
HV Explorer is evolving quickly. It is already useful for offline exploration of hyperspectral datacubes, ROI annotation, spectra comparison, PCA, preprocessing, and supported classification workflows. The parts that touch acquisition, project/workflow management, and broader deployment tooling are still being expanded.
Current Status:
-
Stable core workflow: Open datacubes, inspect bands and spectra, create ROIs, save/load annotations, export spectra, and export processed datacubes.
-
ML workflow: HV Explorer can train, apply, and export supported classification models. Exported annotations and models can be reused from the HV SDK examples.
-
Active development: Live data capture is being added so HV Explorer can connect directly to Hypervision cameras, moving it from an offline analysis tool toward an integrated capture and analysis tool.
-
Planned features: Project management, workflow saving, dead pixel removal, band math, and broader model deployment tooling remain on the roadmap.
The first stable release (v1.0), featuring live data capture support from the Hypervision cameras, is targeted for June 2026.
-
OS: Windows 11 or Linux (Ubuntu 22.04+ recommended)
-
Environment: Python 3.10 or higher
-
RAM: 8GB Minimum (16GB recommended for large HV1700 cubes)
Use HV Explorer to inspect cubes, create ROIs, compare spectra, and train models interactively. Use the HV SDK examples to reproduce the same workflow in Python, load exported annotations and models, and deploy the result in scripts or camera pipelines.
Saving and Reusing Work
HV Explorer does not yet save a complete project file with all open datacubes, views, operations, annotations, trained models, and UI state. Until project saving is available, save the individual artifacts you need to continue the work in a later HV Explorer session or from an HV SDK script.
Think of HV Explorer sessions as reproducible from saved inputs and exports: reopen the datacube, reload annotations, and reapply or export processing steps as needed. Exported processed datacubes preserve the result of the current pipeline, but not the editable operation history.
Reuse Between HV Explorer Sessions
| What to keep | How to save it | How it is reused |
|---|---|---|
| Original datacube and references | Keep the original .pam, .hdr/.raw, or .tif files | Reopen them in a later session and reapply the same workflow. |
| ROI annotations and properties | Save annotations as JSON | Load the JSON in a later session to restore ROIs, labels, colors, and annotation properties. Loaded annotations are appended to the current ROIs. |
| Mean spectra and spectral plots | Export spectra data as CSV, XLSX, or JSON from Spectra settings | Reuse the exported values in analysis notebooks, reports, or SDK training scripts. |
| Processed datacubes | Export the datacube after applying operations | Reopen the exported cube later. The operations are baked into the exported file. |
| Supported classification models | Export the model from ML models | Use the exported model from Python with the HV SDK. Keep the matching annotations and preprocessing notes with the model. |
| Operation settings | Write down the settings or export the processed cube | Full editable workflow/project saving is planned, so operation history is not yet restored automatically. |
Export to the HV SDK
| HV Explorer export | File type | SDK use |
|---|---|---|
| Annotations | JSON | Load ROIs with the annotation examples, or use them for classification, regression, and PCA. |
| Mean spectra | CSV, XLSX, JSON | Train from exported spectra in the classification example. |
| Processed datacube | PAM, ENVI, TIFF | Open it with hsi.open() and continue with the basics or preprocessing examples. |
| Classification model | PKL | Load a supported HV Explorer model in the classification example. |
When moving from HV Explorer to the SDK, keep the datacube, annotations, model, and preprocessing assumptions together. Models and annotations are only directly comparable when they refer to the same image geometry, wavelength order, band selection, calibration, and preprocessing.
Key Features
Data Visualization & Comparison
-
Format & Interleave Agility: Native support for importing and exporting PAM, ENVI and TIFF files. The underlying SDK manages BIP, BIL, and BSQ interleave types interchangeably, ensuring seamless data handling across different HSI standards.
-
Spectral Slicing & RGB Composition: Visualize individual spectral bands with customizable color maps or generate false-color RGB images to highlight specific chemical signatures.
-
Multi-Cube Analysis: Open and compare multiple high-resolution images simultaneously — a task made possible by the underlying HV SDK.
Spectral Analysis & Transformation
-
Flexible ROI Spectroscopy: Plot and compare the mean spectra of multiple Regions of Interest (ROI). The GUI provides flexible selection tools, supporting rectangular, elliptical, and multi-point (free polygon) shapes to precisely isolate features of interest regardless of their geometry.
- Data Export: Export selected spectral data to CSV or export ROI annotations for use in external analytical pipelines, including the HV SDK annotation examples.
-
Preprocessing: Built-in tools for Reflectance Calibration (white/black references), SNV (Standard Normal Variate) normalization, and spectral derivatives ( and order).
-
Smoothing: Noise reduction using Gaussian or Savitzky-Golay filters.
-
Data Reduction: Perform spatial and spectral cropping and binning in all three dimensions () to optimize data cubes for specific analysis tasks.
Advanced Processing & Machine Learning
The HV Explorer provides an accessible interface for complex HSI transformations and predictive modeling:
-
Dimensionality Reduction: Principal Component Analysis (PCA).
-
Unsupervised Learning: Clustering algorithms (e.g., K-Means) for automated feature discovery.
-
Machine Learning: Build and apply classification and regression models in real-time. Currently supported models include:
- Classification: Support Vector Machine, Partial least-squares, and Regularized Least Squares.
- Regression: Support Vector Regression and Least Squares.
Performance: Powered by HV SDK
The HV Explorer is more than just a GUI; it is a visual wrapper for the HV SDK.
-
The 8x Memory Expansion: Hyperspectral cubes are massive — a raw cube from the HV1700 often exceeds 1GB in format. When using these cubes in conventional processing tools, memory usage can grow rapidly when performing just a few operations on the initial data. Type conversions to double-precision floats cause each cube to take 8x the amount of memory, transformations such as matrix-multiplication typically double memory usage temporarily, and in general, a lot of processing time is wasted moving and copying memory. In contrast, the HV Explorer utilizes the SDK's lazy pipeline architecture to process only small slices of the cube at a time and only pull the necessary data required for a given operation, leaving RAM usage low and CPU utilization high.
-
Automatic Interleave Optimization: Different HSI operations require different memory access patterns to be efficient. Under the hood, the HV SDK is used to perform seamless and efficient interleave transformations between BIP, BIL, and BSQ depending on the task (spatial viewing vs. spectral plotting), it ensures localized memory access and fluid performance.
-
Multi-Cube Stability: Because of this memory-mapped approach, users can open and compare multiple large datasets simultaneously on a standard workstation without exhausting system resources.
Workflows
Basic
Advanced
Support
For reporting bugs or requesting assistance, write an email to: support@qtec.com
See also the Support section.