Getting Started
This page introduces the HV Explorer workspace and the first actions needed to start exploring a hyperspectral datacube. You will learn where the main tools are located, how to open example data, how to inspect metadata, and how to use the preview controls before moving on to calibration, annotations, spectra, PCA, and machine-learning workflows.
General Interface
Start by opening HV Explorer. The following interface will appear:
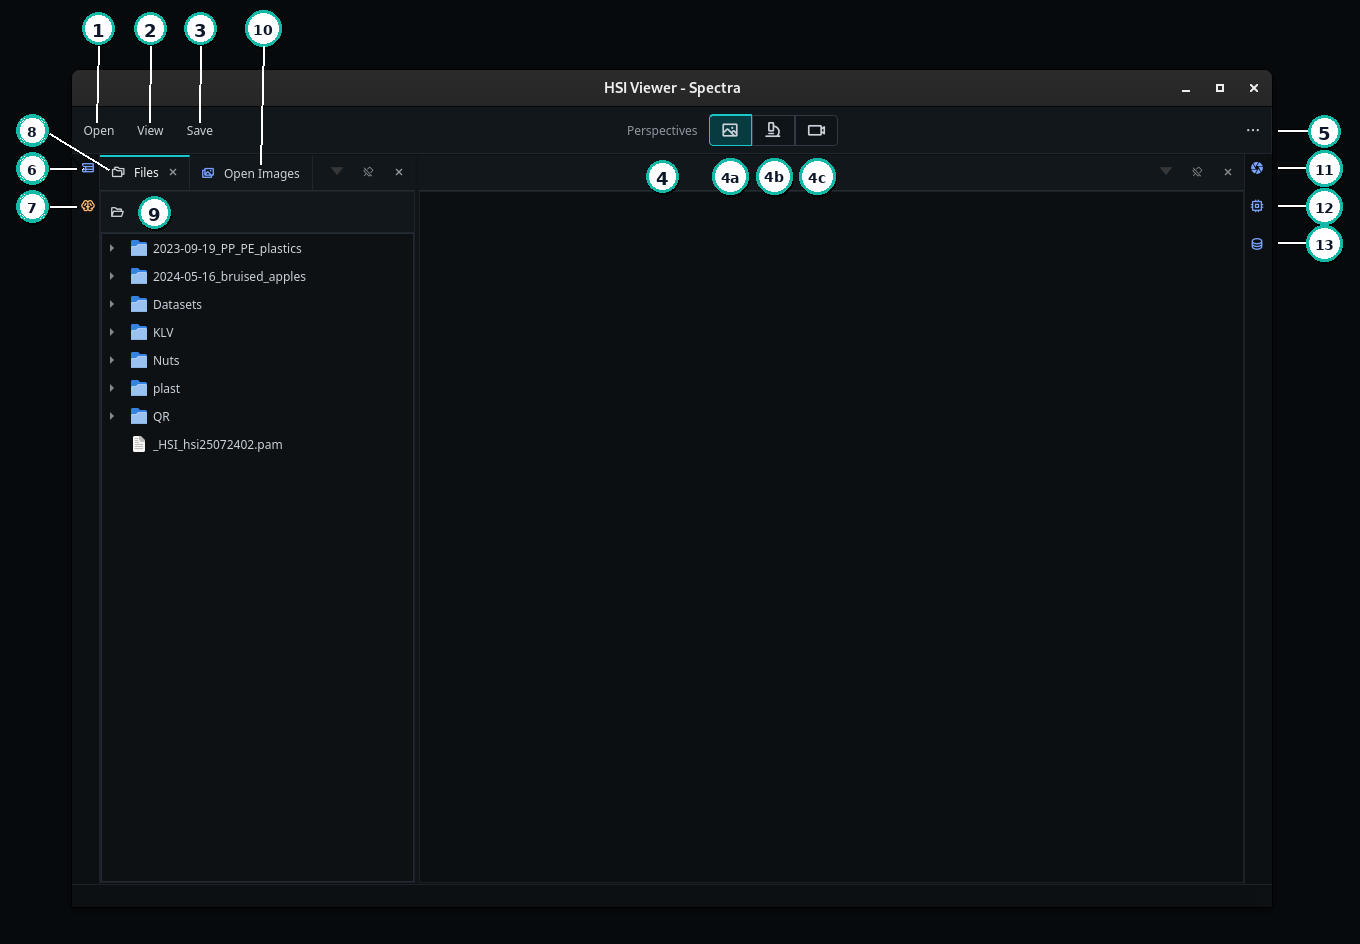
HV Explorer interface
The numbered controls are divided into the top toolbar and the workspace panes. Commands hidden inside menus are described separately below.
Top toolbar
| Number | Control | Description |
|---|---|---|
| 1 | Open menu | Opens datacubes, opens them with the Setup Wizard, or selects the root folder used by the Files pane. |
| 2 | View menu | Shows or hides analysis, recording, file-management, and inspection panes. |
| 3 | Save menu | Exports the processed datacube or the currently displayed preview slice. |
| 4 | Perspective selection | Switches between predefined workspace layouts for general use, analysis, or recording. |
| 5 | More menu | Shows HV Explorer version, copyright, and third-party license information. |
Workspace panes
| Number | Pane | Description |
|---|---|---|
| 6 | Annotations | Creates and manages ROIs, labels, colors, visibility, and annotation properties. |
| 7 | ML trainer | Trains machine-learning models using annotated ROIs. |
| 8 | Files | Browses files and provides actions for opening datacubes. |
| 9 | Open folder | Selects the root folder used by the Files pane and file-based actions. |
| 10 | Open images | Lists the datacubes currently open and switches between them. |
| 11 | Recording inspector | Provides live-capture controls and recording settings. |
| 12 | Workflow editor | Builds processing pipelines containing calibration, crop, binning, band-selection, and model operations. |
| 13 | Metadata inspector | Displays properties such as shape, data type, interleave, and wavelength information. |
Menu commands
Menu commands are not all visible in the default interface screenshot. The following tables describe the actions available from each top-toolbar menu.
Open menu
| Command | Description |
|---|---|
| Open | Opens a PAM, ENVI (HDR), or TIFF datacube. |
| Open and Setup | Opens a datacube and starts the Setup Wizard for wavelength information and reflectance calibration. |
| Open folder | Selects the root folder used by the Files pane and file-based actions. |
View menu
| Command | Description |
|---|---|
| Spectral Viewer | Shows spectra for selected ROIs and point measurements. |
| Annotations | Shows the annotation and ROI tools. |
| PCA | Computes PCA from ROI samples and displays scores and component loadings. |
| Recording | Opens the workspace used for live-capture workflows. |
| Recording Inspector | Shows live-capture controls and recording settings. |
| ML trainer | Shows tools for training models from annotated ROIs. |
| Files | Shows the file-browser pane. |
| Open images | Shows the datacubes currently open in the session. |
| Metadata inspector | Shows metadata for the selected datacube. |
| Workflow editor | Shows the processing-pipeline editor. |
Save menu
| Command | Description |
|---|---|
| Export current image | Exports the processed datacube as PAM, ENVI (HDR), or TIFF using BIL, BIP, or BSQ interleave. |
| Export preview slice | Exports the currently displayed preview slice as a 2D image. |
More menu
| Command | Description |
|---|---|
| About HSI Viewer | Shows the HV Explorer version and copyright information. |
| License information | Shows licenses for the third-party Python packages used by HV Explorer. |
Perspectives and workspace layout
Perspectives provide predefined workspace layouts for different tasks:
| Perspective | Intended use |
|---|---|
| Default | Opening datacubes, viewing images, and inspecting metadata. |
| Analysis | Working with annotations, spectra, PCA, machine-learning models, and processing workflows. |
| Recording | Configuring cameras and performing live capture. |
The panes in HV Explorer can be moved and rearranged to create a workspace that matches your preferred workflow. Each perspective remembers its own pane layout, so switching perspectives restores the arrangement last used for that perspective.
To restore a perspective to its predefined layout, double-click its perspective icon in the top toolbar. This resets only the selected perspective; layouts saved for the other perspectives are not affected.
Loading datacubes
HV Explorer can open datacubes in PAM, ENVI (HDR), and TIFF formats (with BIL, BIP, or BSQ interleave). Datacubes can be loaded in several ways:
- Click the Open Menu (#1) and choose Open to select a datacube with a
file dialog.
- Choose Open and Setup when you want to open a datacube and immediately run the Setup Wizard for wavelength information and reflectance calibration.
- Double-click a file in the Files list (#8) to open that file.
- Right-click a file in the Files list (#8) and choose Open.
- or Open with Setup to run the Setup Wizard.
By default the Files pane starts in the home directory, but this can be
changed using the Open folder (#9) action.
The new folder will be used as the base directory for all file based operations
(save/load annotations, models, data export, ...).
Note that HV SDK (the HV Explorer backend) supports
all three types of interleave for the
PAM file format.
However, in order to determine the interleave and properly load the files, it
expects the interleave type to be specified in the TUPLTYPE part of the header.
In this example we have used the mixed nuts example data: mix1.pam, containing almonds, walnuts and hazelnuts.
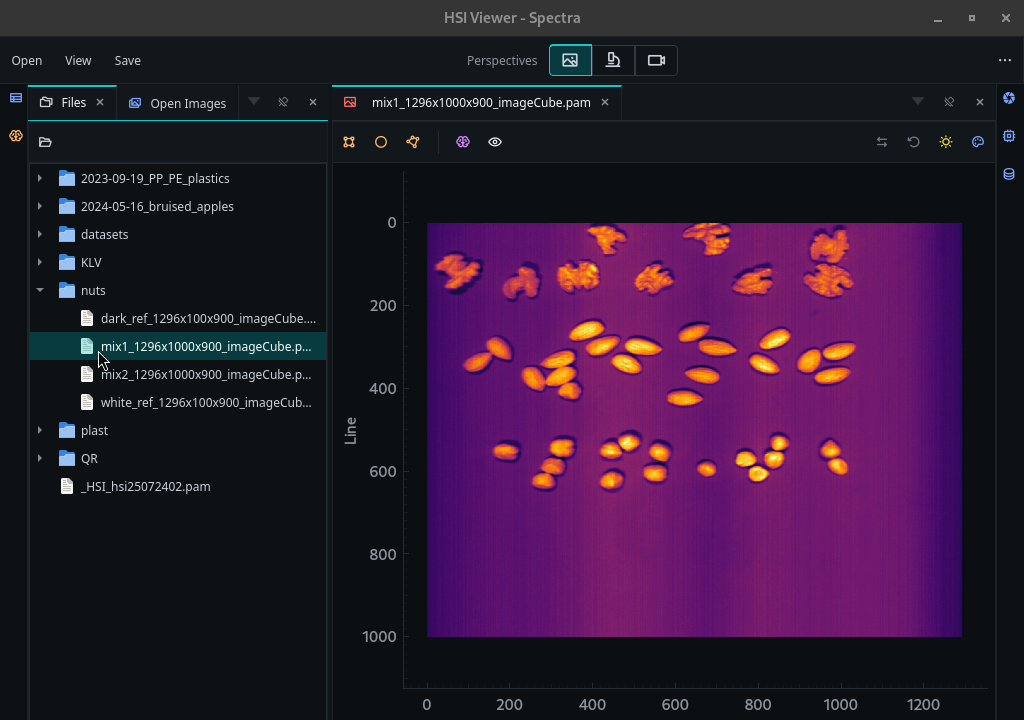
HV Explorer: image loaded
After loading, the datacube is added to Open Images (#10).
When opened normally, the preview starts in Gray mode, showing the middle
band with the default inferno color map (in this example, the cube has 900
bands, so band 450 is shown). When opened with the
Setup Wizard, the preview
starts in Color mode using the False RGB preset.
It is possible to move the image around and zoom in/out by using the mouse.
Open Images pane
Loaded datacubes are listed in the Open Images pane (#10). Click an entry to switch to that datacube. To close a datacube, right-click its entry and select Remove image. Removing an image closes it in HV Explorer but does not delete the source file.
Each datacube has a preview tab in the main view area. Closing that tab hides the preview but leaves the datacube open — it remains listed in Open Images and continues to be available for spectral, PCA, and ML workflows. To fully close a datacube, right-click its entry in Open Images and select Remove image.
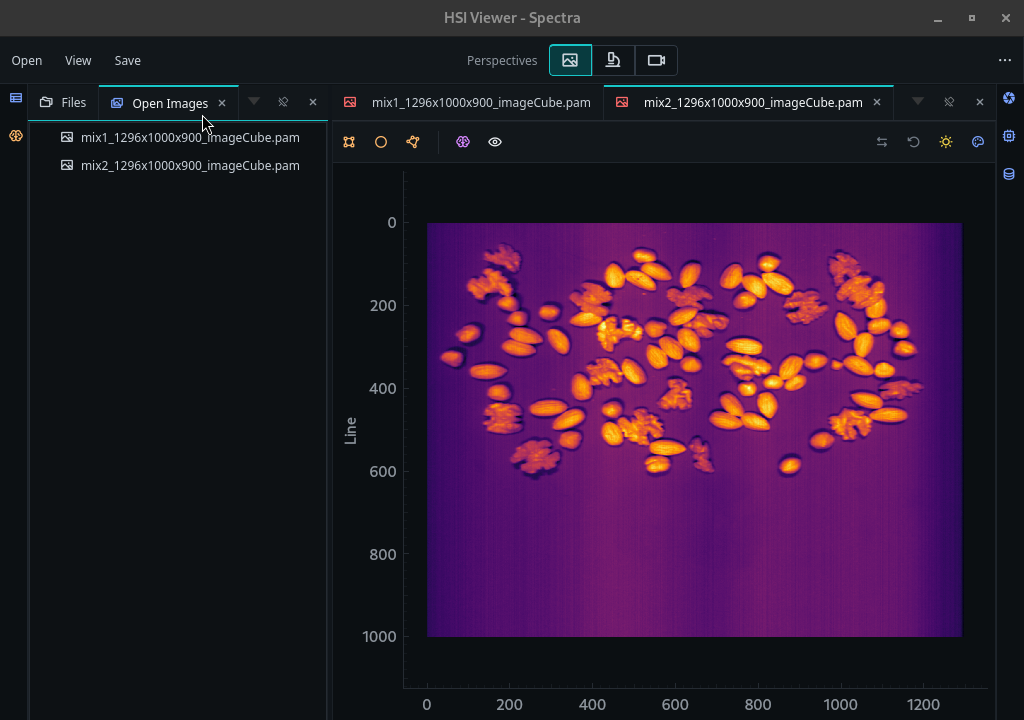
HV Explorer: image loaded
Because HV Explorer uses the HV SDK lazy loading model, opening a datacube does not immediately load the full hyperspectral cube into RAM. Data is read and processed only when needed for preview, spectra, operations, export, or model workflows. This makes it practical to keep multiple large datacubes open for comparison without exhausting system memory.
Demo
HV Explorer: loading datacubes
Preview Settings
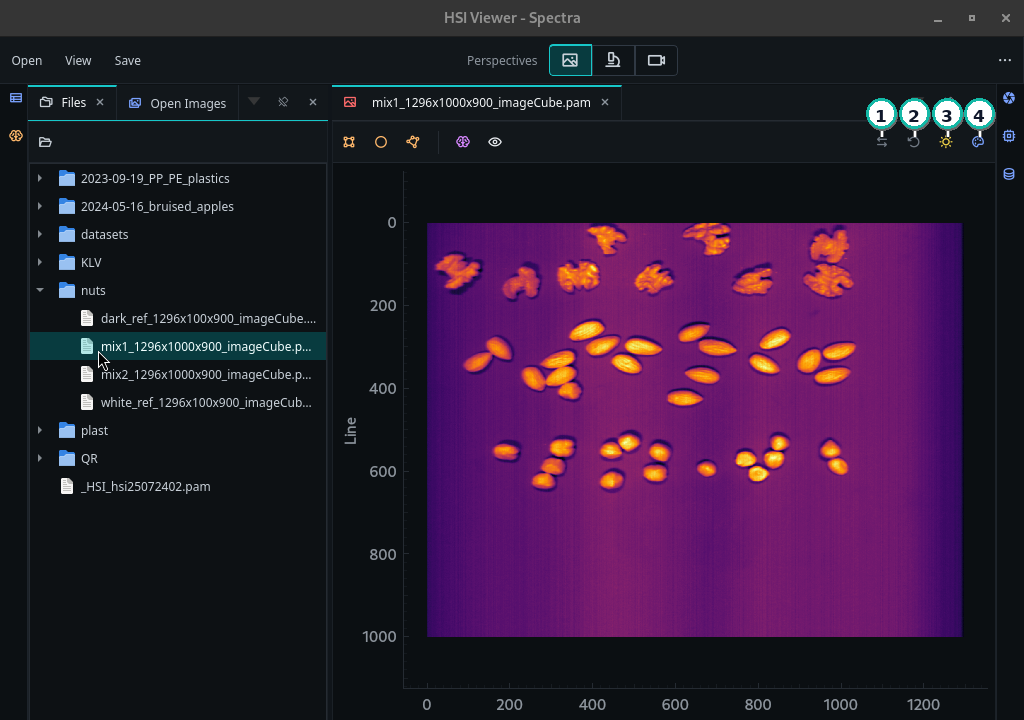
HV Explorer: preview settings
After a datacube has been loaded, the preview toolbar can be used to adjust how the datacube is displayed. These settings affect the preview only; they do not change the underlying datacube or processing pipeline. The controls are available through the four icons on the top right of the preview window:
| Number | Setting | Description |
|---|---|---|
| 1 | Mirror image horizontally | Toggle horizontal mirroring of the preview image. |
| 2 | Transpose spatial axes | Toggle transposition of the spatial axes in the preview image. |
| 3 | Brightness settings | Open contrast stretching controls for automatic or manual brightness adjustment. |
| 4 | Mode and channel settings | Open controls for selecting Gray or Color preview mode, bands/channels, color maps, and presets. |
Use Mirror image horizontally and Transpose spatial axes when the preview orientation does not match the physical sample layout on a Lab Scanner. These settings only change how the datacube is displayed in HV Explorer, making it easier to compare the screen with the sample position and scan direction.
Brightness settings
The brightness controls adjust the contrast stretch used for the displayed preview slice. By default, Auto Brightness is enabled so HV Explorer chooses a useful display range automatically. When Auto Brightness is disabled, use the Min and Max sliders to set the display range manually.
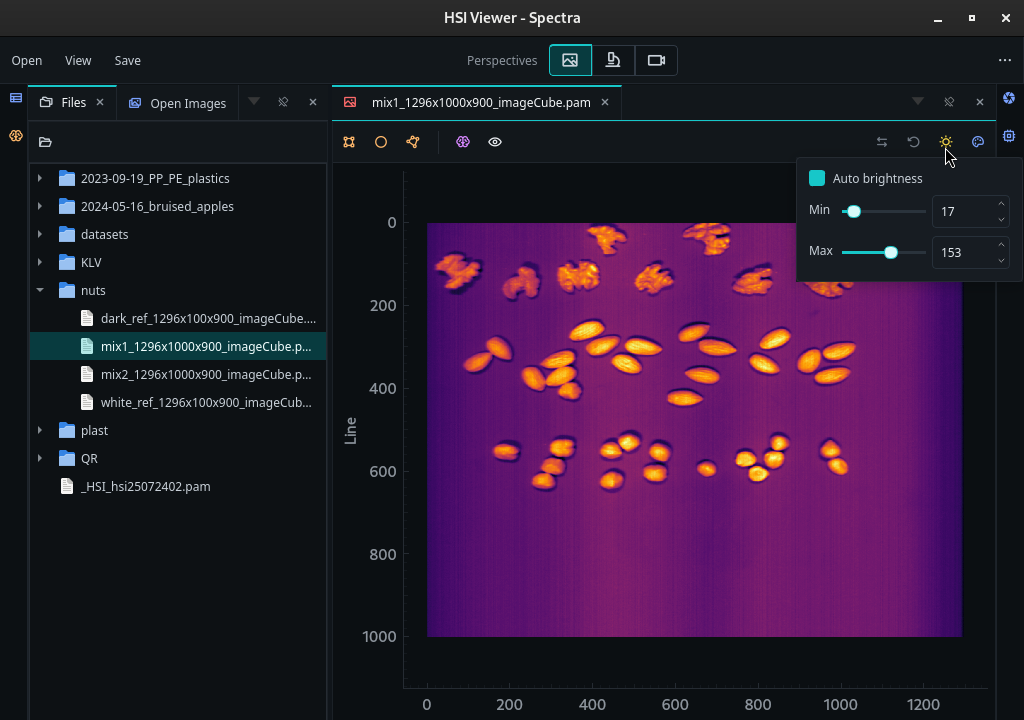
HV Explorer: brightness settings
Mode and channel settings
The mode and channel settings control whether the preview is shown as a single band or as a false-color composite.
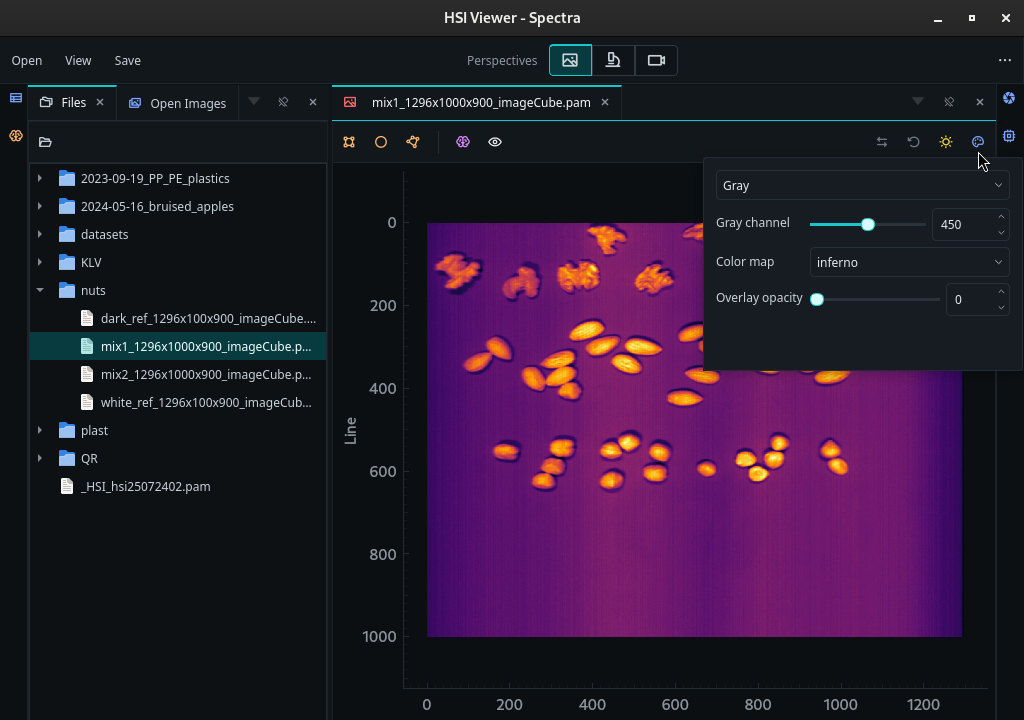
HV Explorer: gray preview mode
Gray
In Gray mode, one channel/band is displayed using a selected color map.
| Setting | Description |
|---|---|
| Gray channel | Selects which band is displayed. |
| Color map | Chooses the color map used for the grayscale image of the selected band. |
Color
In Color mode, a false-color image is generated from selected bands. More than one neighboring band can be averaged into each color channel to reduce noise.
| Setting | Description |
|---|---|
| Red channel | Selects which band is used for the red channel. |
| Green channel | Selects which band is used for the green channel. |
| Blue channel | Selects which band is used for the blue channel. |
| Channel Average | Selects how many neighboring bands are averaged into each color channel. |
| Presets | Selects predefined false-color mappings such as False RGB color or Infrared RGB 1 (CIR). Presets require wavelength information from the datacube metadata, the Setup Wizard, or the Wavelength Spec operation. |
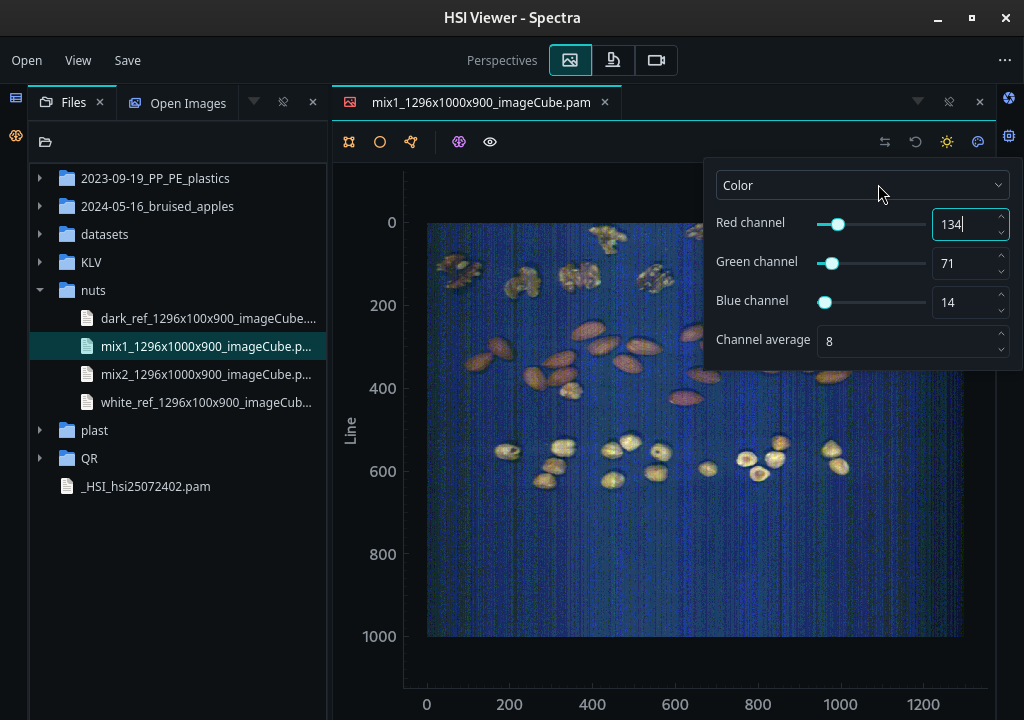
HV Explorer: color preview mode
For a full-range HV 1700 datacube with 900 bands, approximate conversions are:
- Band index:
B = (W - 430) * 899 / (1700 - 430) - Wavelength:
W = B * (1700 - 430) / 899 + 430
Common values:
| Color | Wavelength | Band index |
|---|---|---|
| R | ~620 nm | 134 |
| G | ~530 nm | 71 |
| B | ~450 nm | 14 |
Demo
HV Explorer: Preview inspector
Exporting the preview slice
Use Save > Export preview slice to save the currently rendered preview as a PNG or JPEG image. The exported image reflects the selected gray or color mode, channels, color map, and brightness adjustment. It is a 2D visualization, not a hyperspectral datacube; use Export current image when the spectral data must be preserved.
Metadata inspector
The Metadata inspector (#13) shows the properties of the currently selected datacube and updates as workflow operations change the result. Use it to verify the shape, data type, interleave, wavelength information, and other header metadata before analysis or export.
| Dimension | Meaning |
|---|---|
| Lines | Number of scan lines, corresponding to image height. |
| Samples | Spatial width. |
| Bands | Number of spectral channels. |
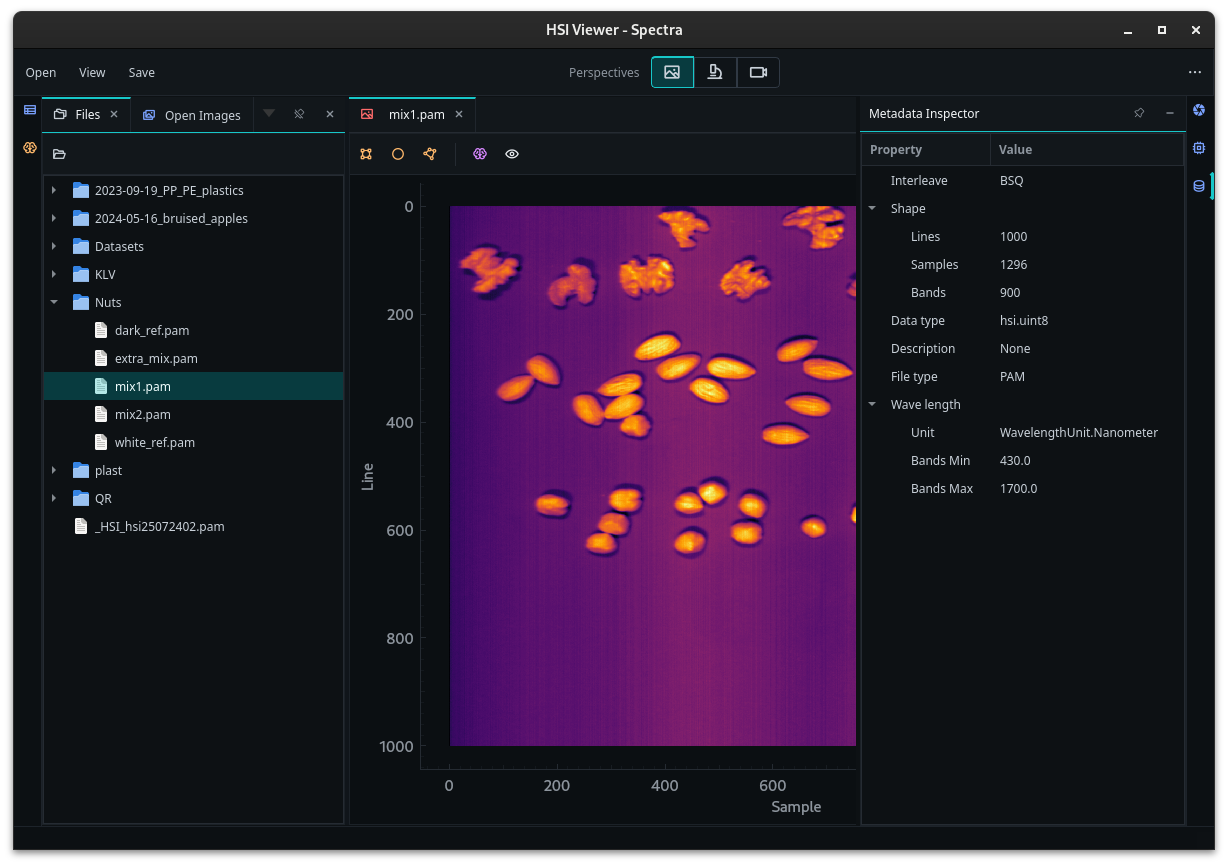
HV Explorer: metadata information
The Metadata inspector is useful even when no wavelength information is available. When wavelengths are missing, add them with Wavelength Spec or the Setup Wizard.